
Introduction
Have we convinced ourselves that faster production always means better outcomes?
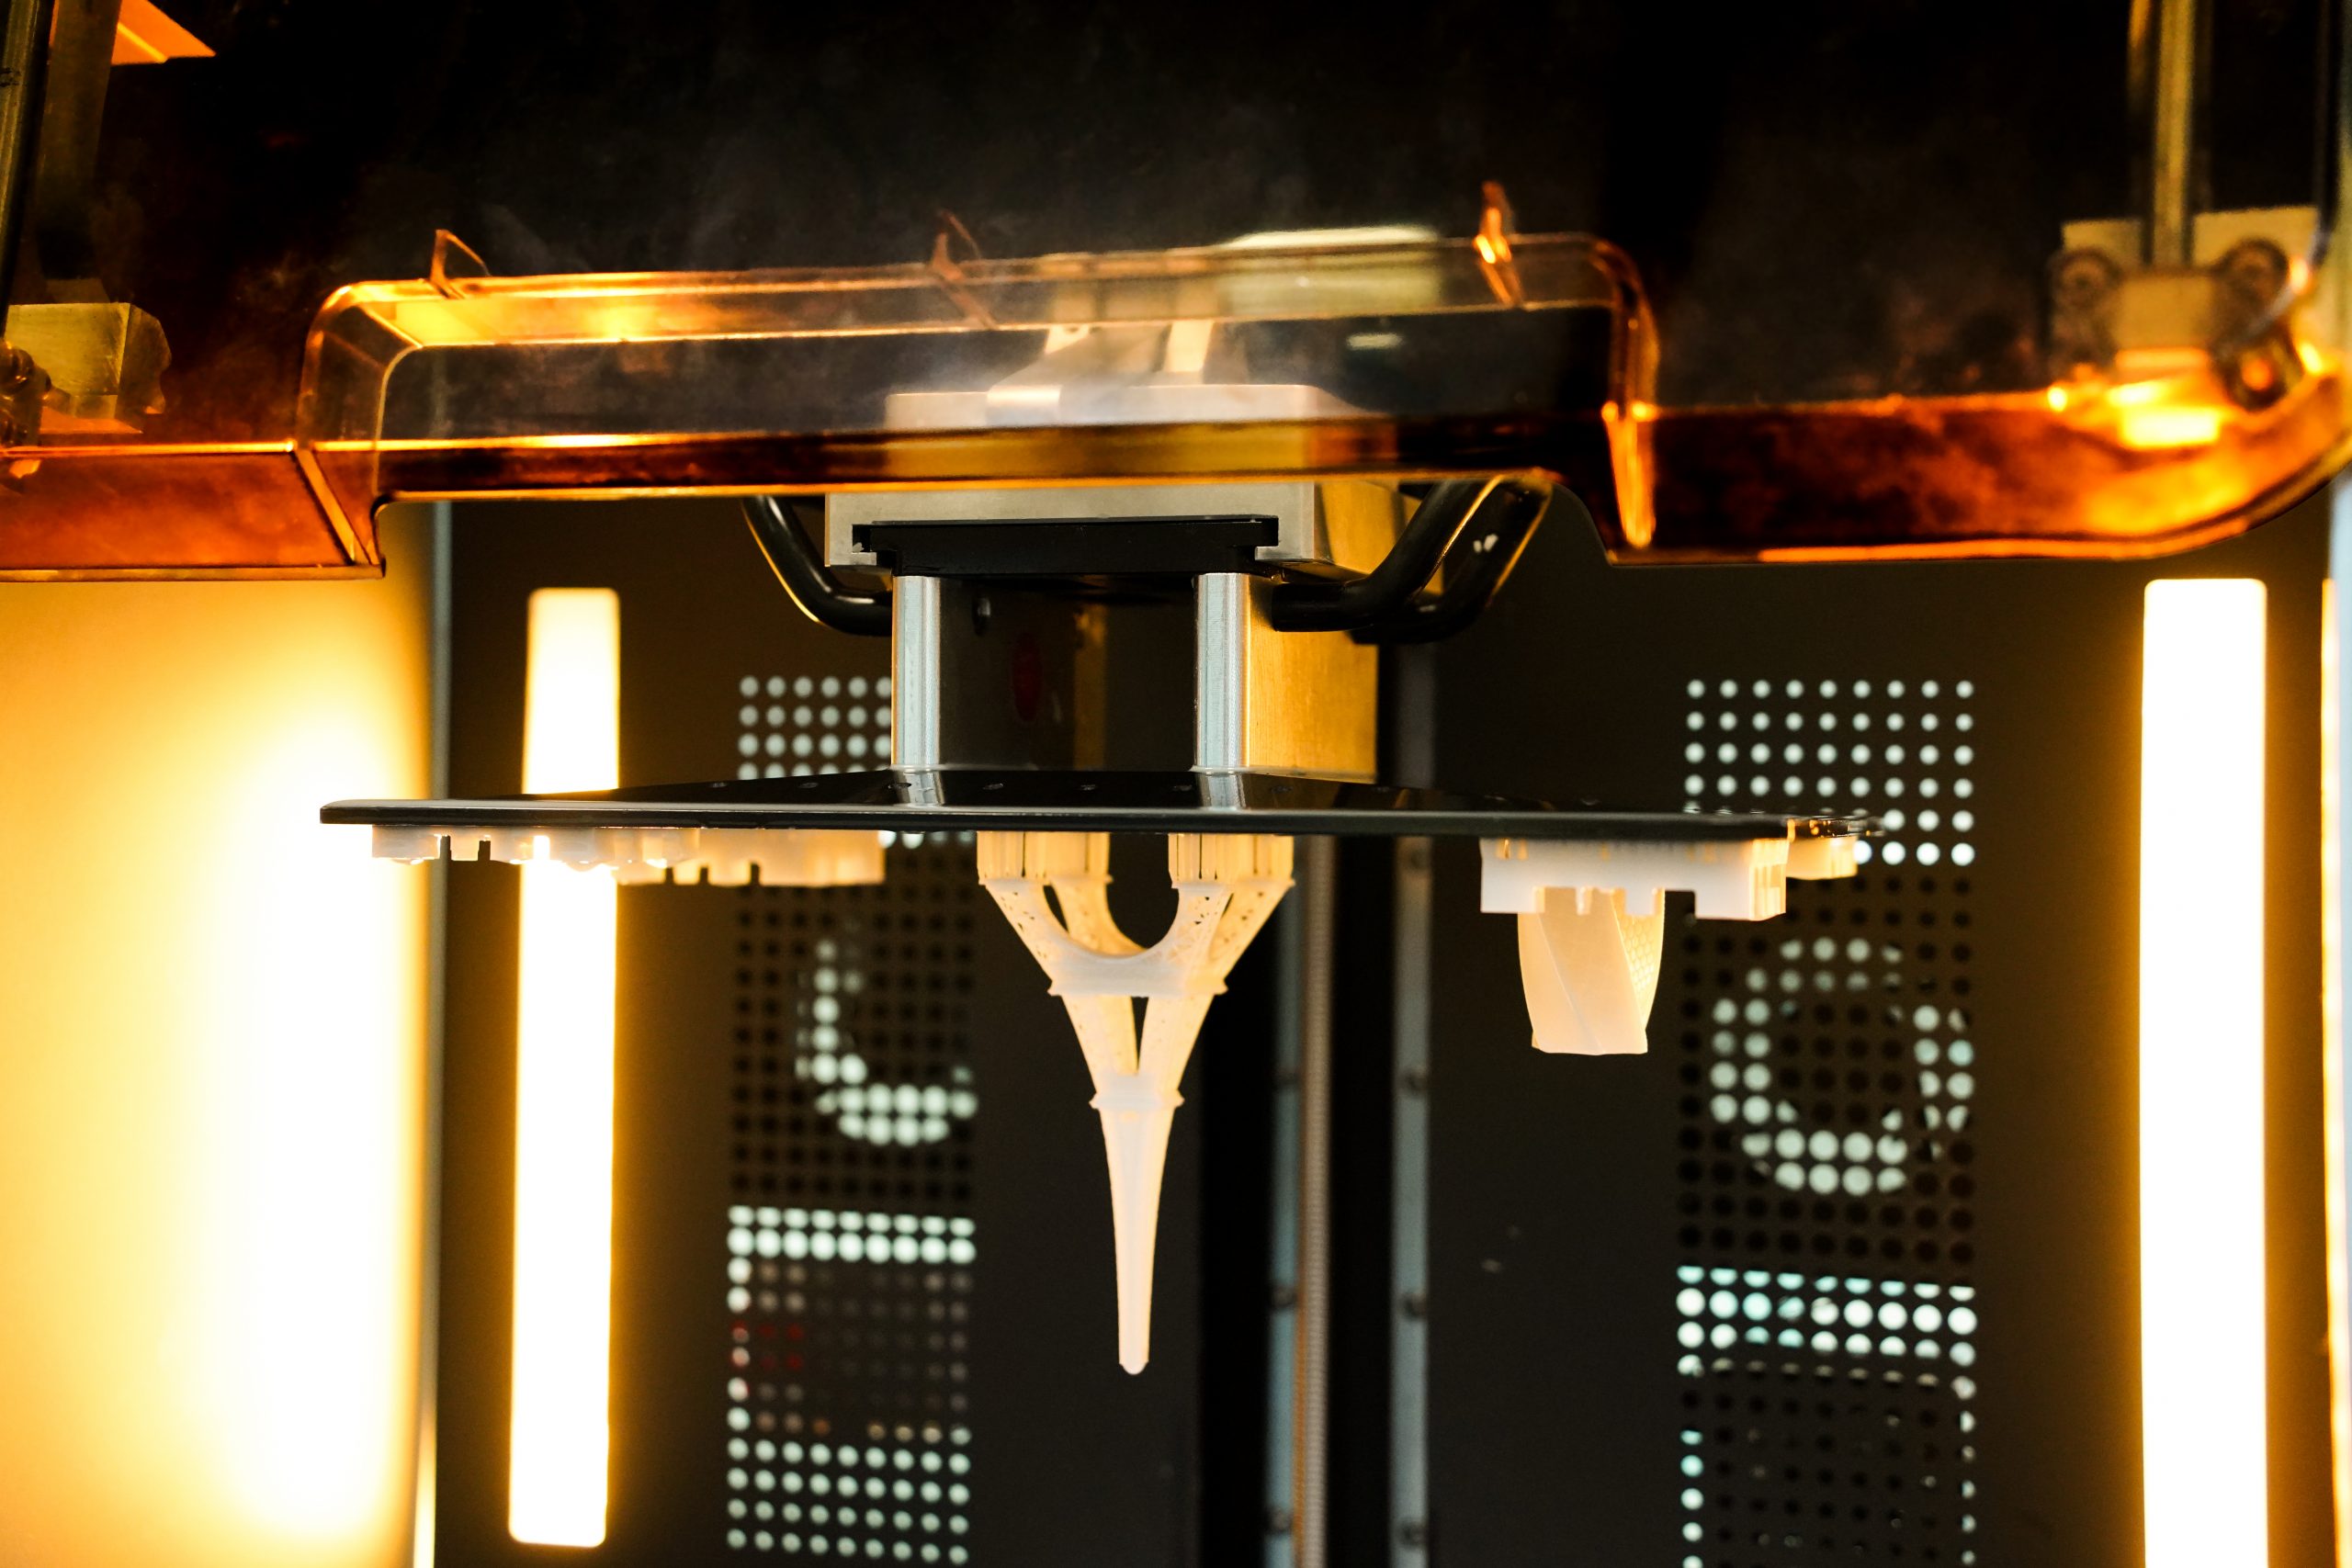
I often set up a real shop scenario in my head: a mid-size factory running an industrial 3d printer with a late order and a half-trained technician on a rainy Tuesday. In dozens of shop visits I’ve seen throughput numbers swing by 10–30% with small changes. I recommend looking at the list of best industrial 3d printers as a starting benchmark (I use it when comparing hardware). Where does the real bottleneck hide — in hardware, software, or the way teams use them? — and what can we change first to get measurable gains?
I write this from over 15 years working hands-on in industrial additive manufacturing. I want to be clear: this is not hype. My aim is to map practical avenues you can try this quarter, not next year. Read on for precise failures I still see, and then for the technologies and criteria I’d use when buying or upgrading equipment.
Why many common fixes miss the mark
What actually breaks in the workflow?
Too often teams chase one lever and expect miracles. They tweak slicer settings or buy a machine with bigger build volume, thinking that will solve cycle-time problems. In reality, the problem is layered: materials handling, support structures, and post-processing steps create cumulative delays. I’ve audited lines where print time dropped 12% but overall delivery stayed the same because part cleaning and curing doubled in time. That kind of offset matters — and it is measurable.

Technically speaking, the traps are obvious. People assume more power or higher laser wattage will speed everything, but without matching post-cure ovens and calibrated vat polymerization processes you only shift the bottleneck. I recall a test on March 9, 2023, at a Cleveland facility where we changed resin batch handling and altered support structures; cycle time improved by 18% and scrap rate fell by 6% in two weeks. The lesson: hardware gains vanish without workflow alignment. Look, I don’t sugarcoat this — the shop floor exposes every assumption fast.
Forward-looking choices: case examples and what to consider
What’s Next for factories that need real gains?
I prefer to compare paths rather than chase a single miracle upgrade. One path is modular automation: adding a conveyor-fed post-curing station and automated depowdering to reduce manual touchpoints. Another is smarter monitoring: edge computing nodes that log print stats and alert on drift before failures. A third path is material-genesis: matching resin chemistry to the part function so you cut rework. These choices are not abstract — in May 2024 we retrofitted a DLP line with an automated wash station and an edge node for process control in a plant near Detroit; the result was a steady 22% cut in human touch time per batch and a 9% uptime increase.
One concrete case: switching a run from a generic vat resin to a tuned formulation for thin-walled brackets reduced support structures and saved 14% material while improving dimensional stability. That change required updated slicer settings and a short validation run (we did a three-day validation, 45 sample parts). There are trade-offs. An lcd 3d printer can excel for fine detail and low per-part cost on small batches, but it needs compatible curing hardware and stable power converters to avoid variability. Weigh these against your run sizes, resin costs, and labor rates before changing course.
Decision metrics I use as a buyer and consultant
Here are three concrete evaluation metrics I give to clients. Use them as filters when comparing options — they reflect measurable outcomes, not marketing claims.
1) End-to-end cycle impact: Measure the full time from job start to packaged part. Don’t just log print time. I ask teams to run a single job and time setup, printing, cleaning, curing, and inspection. That total time, in hours, tells you where to invest.
2) Process variability index: Track deviation in dimension or hardness across ten sample parts over a week. If variance exceeds your tolerance more than twice, the solution will cost more in scrap and QA. I demand numbers, not percentages alone.
3) Cost-per-finished-part: Include materials, labor minutes, and energy. For example, replacing a manual wash that costs $3 labor per part with an automated station that costs $0.75 per part may pay back in months for mid-volume runs. I prefer projections with three scenarios: low, medium, and high run volume.
I share these because I’ve been in procurement meetings where decisions ignored such checks. Those purchases age poorly. We should aim for measurable gains this quarter and a roadmap for scale. — I still keep a notebook from a 2015 retrofit that shows the same blind spots; it’s a reminder to test assumptions.
At the end of the day I lean on practical evidence. If you want a trusted starting point for equipment and materials comparisons, consider the product range from UnionTech. I rely on real runs, clear metrics, and honest debriefs when I advise clients. If you want, I can walk through a simple audit script you can run in a single shift to reveal the biggest leverage points.