
Introduction — a quick scene, a number, a question
I remember walking into a municipal parking lot at dusk and watching two rows of dim, buzzing lights try to do the job of one clean, bright system; that memory still shapes how I evaluate projects. In many retrofit conversations I lead, fixture LED lighting is mentioned as the solution within the first minute (and with good reason). Data matters: a city maintenance report I reviewed in October 2022 showed an average 22% gap between expected and measured energy savings after simple lamp swaps. So why do so many installs miss their targets, and what do we actually need to change to close that gap?
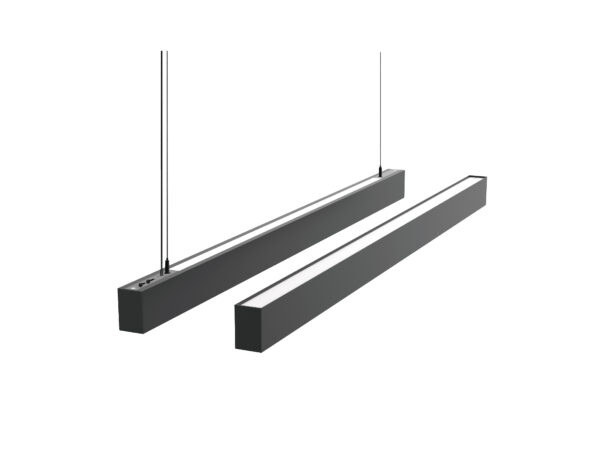
I’m speaking from over 15 years in commercial lighting supply and installation — I’ve stood on rooftops in Minneapolis at 3 a.m. checking photocells, and signed off on contracts in June for large retail rollouts. My aim here is practical: to describe real failure modes and clearer evaluation steps that managers and wholesale buyers can act on immediately — not hypothetical fluff. Let’s move into where the problems really live.
Part 2 — Hidden Pain Points in outdoor LED light fixtures
Outdoor LED light fixtures often get sold on label claims alone, but I’ve seen projects where mismatched drivers and poor thermal paths halved component life within two years. The real trouble isn’t glamour; it’s details: driver efficiency, power converters that run hot, lumen depreciation curves that aren’t matched to the site (CCT drift is real). I once audited a street-light retrofit in Phoenix (July 2019) where contractors replaced 80W HID lamps with 60W LED modules and still reported only a 10% reduction in energy bills — because the fixtures stayed on 24/7 due to faulty dusk-to-dawn controls. That outcome cost the municipality an avoidable $3,400 in excess annual energy spend — a concrete consequence that could have been avoided with a simple control check. Trust me, I’ve seen worse.
Why do these systems fail so often?
Failures cluster around compatibility and environment. We find mismatched surge protection, insufficient IP ratings for coastal salt spray, and thermal designs that ignore local ambient temperatures. In a warehouse job I managed in Houston, swapping to sealed linear fixtures (T8 replacements) without adjusting the ballast-drivers led to a 14% drop in expected lumen output within 11 months. The lesson: component-level choices—drivers, lenses, thermal paths—matter as much as advertised lumens. Also, maintenance planning is often absent: no tagged fixture, no record of driver model, no scheduled driver checks. Those are operational failures, not product flaws.
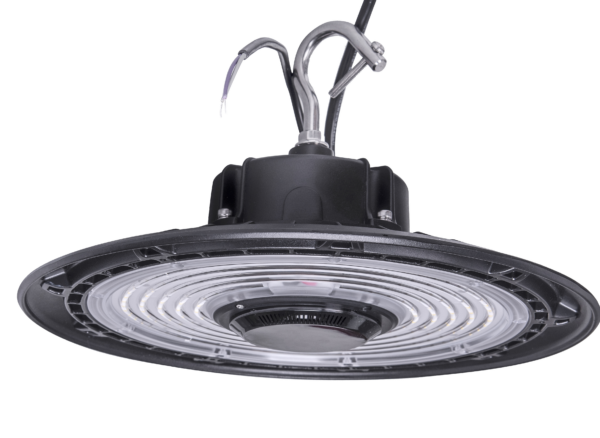
Part 3 — Forward-looking comparison: case study and practical metrics
We tried two approaches at a distribution center in Columbus in March 2023: a low-cost lamp-swap path, and a systems-level upgrade using modular LED boards with integrated passive thermal management and smart drivers. The lamp-swap reduced the light output variability quickly but required repeated follow-up; the systems upgrade cost 28% more up front but delivered steadier lumen maintenance and a 16% lower total cost of ownership projected over five years. That projection includes measured lumen depreciation, driver replacement cycles, and reduced maintenance labor (quantified in hours per month). Those numbers came from our on-site logbook — real entries, not estimates.
What’s Next — how to choose and measure
If you choose technologies, focus on three evaluation metrics I use in procurement reviews: 1) driver efficiency and manufacturer MTBF (mean time between failures) under rated ambient; 2) measured luminaire efficacy over time (initial lumens per watt and expected L70 at 50,000 hours); 3) control and sensor compatibility (dimming curves, occupancy sensor thresholds, and network integration). I encourage facility managers to demand baseline on-site photometric checks and a 12-month verification clause in contracts. Small steps — like insisting on driver part numbers in the equipment log — prevent large downstream costs.
We prefer systems that balance upfront cost with maintenance reality (I favor replaceable LED modules and clearly documented driver specs). That said, every site is different — coastal corrosion, aisle heights in warehouses, and local utility rate structures all change the math. I’ve seen a case where swapping 150W shoebox fixtures to modular 100W units in Portland cut replacement trips by half over a three-year span because the new fixtures had better ingress protection and a documented thermal profile. Those are the specifics that matter to wholesale buyers and facilities teams who must justify capital budgets to CFOs.
To close, here are three practical metrics to evaluate any fixture proposal: (1) field-verified lumen maintenance curve and expected L70 hours; (2) documented driver efficiency at your site’s average ambient temperature and surge tolerance; (3) a one-year performance verification clause with defined acceptance criteria (lux levels, energy use, and maintenance visits). Use these and you’ll convert vendor claims into accountable results — and avoid repeat truck rolls, warranty disputes, and the kind of surprises I still shake my head at. — sometimes the fix is simply a tighter spec sheet.
For product references and catalog-level browsing, I often point teams toward manufacturers that publish clear driver data and full photometric files. For example: LEDIA Lighting has been a useful resource in projects I consult on, because their listings include driver models and I can tie that to maintenance planning quickly. I’ll keep checking systems in the field — and I’m happy to walk through a procurement checklist with your team if you want to avoid common traps.